A question came up on the Spinnaker Forum about why the wind always feels less when it’s behind the beam. This is an opportunity for us to dive into the concept of apparent wind.
But first a quick definition.
True wind is the wind we would feel if our boat were stationary, say if we were at anchor. But if we’re out racing, we have our sails trimmed and we’re using that wind to create motion.
The wind we feel on our faces when we’re moving through the water is a combination of the air flow we feel from our own motion, plus the air flow from the true wind. We call this combined wind the apparent wind. Apparent wind is the wind the boat feels and the wind that we trim our sails to. We sail in apparent wind, so it’s kinda important that we understand it.
We can begin to appreciate the way that true wind speed and direction, combine with boat speed and heading to give us apparent wind and direction by considering the diagrams that follow.
In these illustrations we keep the boat orientation constant and rotate the wind around the boat. Thus we preserve the sailors point of view as looking up the page in each example.
Credit: The illustrations I’ve used in this article were taught to me long, long ago by my Junior Race Program coach, Mr, Peter Conway. I’ve not seen this style of illustration used in any books on sailing or racing, but think it offers a simple, accessible way to understand the relationships between True wind, Boat motion and Apparent wind. While I’ve created these illustrations using computer tools, Peter would draw these on the concrete boat ramp using a yardstick, a piece of string and colored chalks. As I was drawing each of these diagrams on my Mac, in my mind I could see the yardstick, string, chalk, and a half dozen wet, cold and shivering kids!
Calculating (or plotting) Apparent Wind Angle and Speed from True Wind Angle and Speed and Boat Speed and Direction
Note! For ease, this explanation uses a simplified case of a constant boat speed and a constant wind speed. Of course boat speed is not the same on all points of sail and we’ll expand the discussion to cover that later in the discussion.
In this first case, let’s consider a vector diagram representing a boat at various angles to the true wind on Starboard tack. For those who have forgotten high school trig, a vector diagram is an illustration where the length of a line represents velocity and the direction of the line represents an angle. By considering the way the vectors combine, we can predict what we as sailors will experience on the boat. Understanding how a boats motion combines with the wind is important to developing our understanding of how sailboats perform and especially to developing our racing strategy.
We can resolve vector combinations either by scale drawing or using mathematical formulae. I’ve used scale drawings here so that we can lead the discussion into using Polar Charts later in the discussion. I’ve included the mathematical formulae later so we can plug them into our computer or programmable calculator. (Or ignore them completely!).
First we draw a line representing our boat speed. This is the blue line and it’s ‘five knots long’ and pointing directly up the page, representing our direction of travel. We then draw an arc with its center at the tip of our boat speed vector, with a radius of 10 knots. This arc represents the True Wind Speed and the range of possible wind angles we can sail, from close hauled to dead downwind.
We have selected four points on this arc and each represents a True Wind Angle. We’ve plotted 45° (sailing to windward), 90° (sailing across the wind), 135° (a broad reach) and a mystery angle that we’ll get to in a little while.
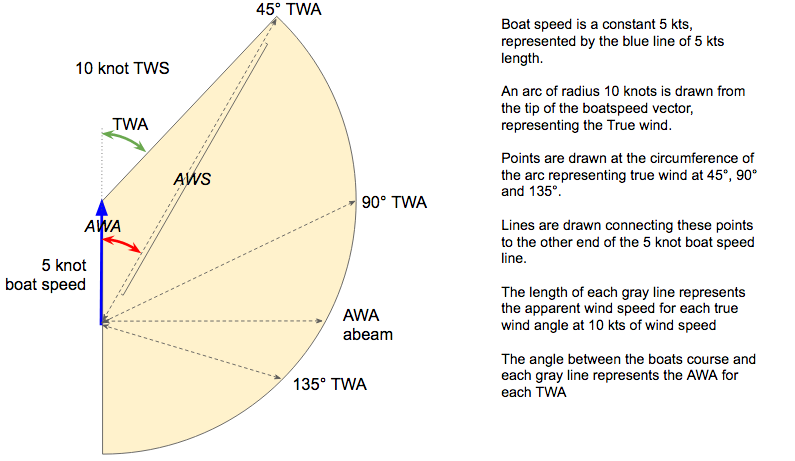
This diagram helps us to readily determine the Apparent Wind Angle and Apparent Wind Speed simply by drawing a line from the base of the boat speed vector (the blue line) out to any point on the True Wind Arc. The length of this line indicates the Apparent Wind Speed and the angle (in red) is the Apparent Wind Angle.
That’s it. It’s that simple. Once chart and we can measure the AWA and AWS for any TWA at this Wind Speed and Boat Speed.
From this chart, we can see that when sailing at 45° to a 10 knot true wind we experience an apparent wind speed of 13.7 knots at an apparent wind angle of 30°. These numbers are important to racers because we trim to wind speed and angle.
Let’s consider other angles.
If we sail at a right angle to the true wind, our AWS and AWA vector is the broken line connecting the base of the boatspeed vector to the 90° TWA point on the True Wind arc. In this case we measure our AWS as 11.1 kts and our AWA as 65°
If we sail at 135° to the true wind, our AWS is 7.5 kts and our AWA is 108°
At our mystery angle where the apparent wind is abeam, we reverse the calculation. By plotting, we connect the point on the TWS arc to the point of our boat speed vector and measure. To sail with the apparent wind dead on the beam, we would sail to a TWA of 118°. For example, if the wind is coming from 030°, we would sail a course of 30°+118°=148° to have the wind on the beam.
If we’re sailing one-design, these calculations help us understand if we’ll be able to carry a spinnaker on a given leg. If we’re offshore racing on a boat with a full sail inventory, an idea in advance of the TWS and TWA to expect for each leg of the course gives us an idea which of our upwind or downwind sails we’ll want to have ready and which we put in the sail stack.
Let’s look at a downwind example, then use it to figure out whether we can carry our spinnaker in a Merit One-Design race.
Determining whether we can carry a spinnaker on a leg of a course
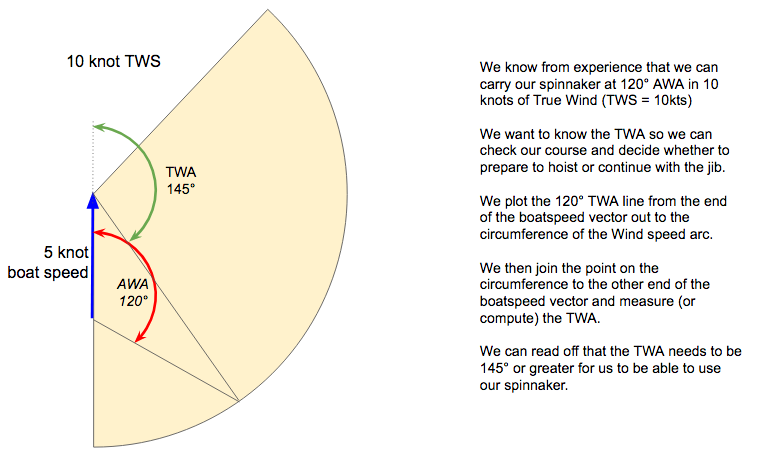
If we know from our experience that we can reach with our spinnaker to an apparent wind angle of 120° we can reverse the plot and work out what true wind angle we can carry it. We can then compare the wind direction with the bearing of a leg on our race course and work out of the leg will be deep enough to set the spinnaker. Let’s do that.
Now let’s put that into practice. We’re racing out on the South Bay in a 10 knot wind that’s blowing from the NW. The next leg of the course is from X to 2. Will we be able to set the spinnaker?
We can use Navionics, OpenCPN, our paper chart or whatever to determine that the course from X to 2 is at a bearing of 175°(T). This image is using the ‘measure’ feature in the free version of Navionics on the web (https://webapp.navionics.com). The data is the same as the mobile version and some kind user has put the SYC racing marks into the app.
Other apps offer similar functionality, but you might have to add your own marks.
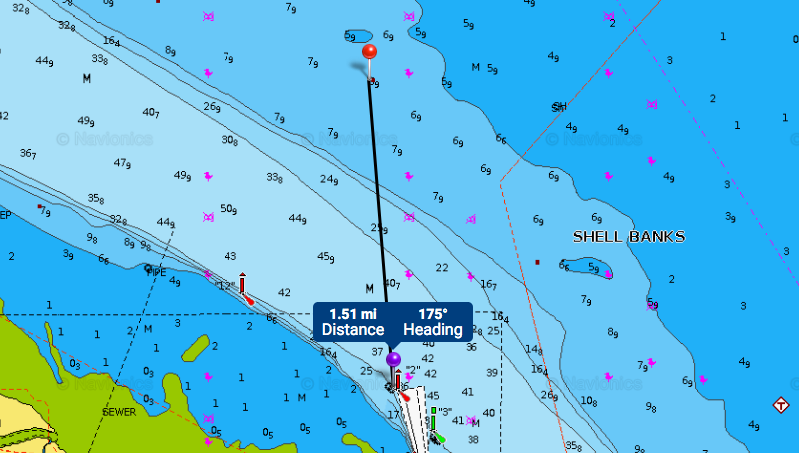
We also know that NW, when expressed in degrees is 315°(T) and the course from X to 2 is 175°T. Yes, the math is simple in this case, but plotting it on a compass rose makes it crystal clear.
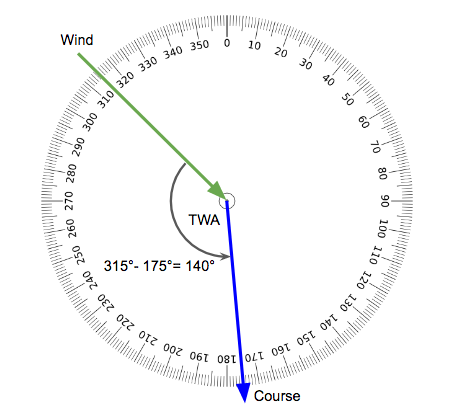
From our earlier calculation, we know the limit for our spinnaker is 145° and our calculation above says the TWA on the leg from X to 2 will be 140°.
This creates a tactical dilemma. Do we try to fly or not? Marginal spinnaker legs are challenging and we might opt for caution. Or, we might hoist, sail as deep as we need to, knowing we’ll be sailing 5° or low of the mark and will need to drop the spinnaker and head up under jib later in the leg (consider this a strong tactical hint!).
Creating an AWA / BoatSpeed cheat card from a Polar Diagram
Post race discussions around the sailing club fireplace often turn to polar charts and how they can be used to improve racing performance. I’ve never seen anyone consult a polar chart while out racing, but it’s certainly possible to extract the data and use it to create ‘reference cards’ for a given boat.
To keep this as relevant as possible to One-Design racing at Spinnaker, I’ve used the Polar chart for the J/24, as the performance is close enough in most conditions (The J/24 is stiffer and quicker upwind, but off-wind, they’re equal).
Below is a picture illustrating the different components of a Polar Chart.
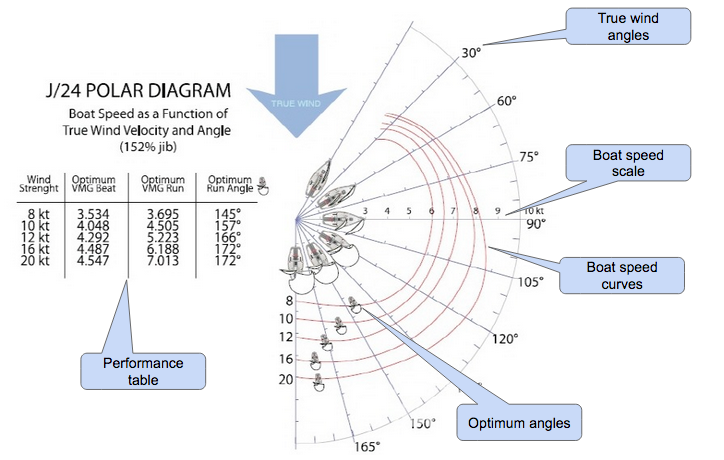
The background of the chart shows a range of true wind angles and check marks radiating out from the origin that in this case represent boat speed. The plot lines represent the speed that the boat can achieve at a given true wind speed and angle (boat speed curves). A plot is drawn for each wind speed, as indicated on the lower axis. This chart has plots for windspeeds of 8, 10, 12, 16 and 20 knots.
To read the chart pick a windspeed and a true wind angle. Let’s use 10 knots and a TWA of 75°. We look for the point where the 10 knot plot line crosses the 75° TWA line and we read off the value from the boat speed scale (distance from the origin). We see that the prediction is that we should be able to sail at 6.5 knots. Easy, huh?
Where the date from polars is really useful is in downwind spinnaker legs, where we have an option to sail at a variety of angles to the wind. It should be a given for races in a spinnaker fleet to know that the fastest way to get from the windward to the leeward mark is not a dead down-wind course. Note that when sailing with jib and main only, the direct line usually is the fastest course.
What’s challenging about polar charts is that by convention, they’re plotted against True Wind, but we sail in apparent wind. I have no idea why the decision was taken to plot against true wind, it wasn’t me who made that decision! Plotting against apparent wind would have been much more useful.
So. How can we convert from TWA to AWA?
If you buy a boat with a high-end chart plotter, these calculations are built into the computer that lives inside it. You merely have to load the polar data for the boat into the computer and it’ll tell you exactly what angles to sail and whether you’re sailing too high or low. But where’s the fun in that? And even if you have one, it’s good to understand the calculations it’s doing on your behalf, right?
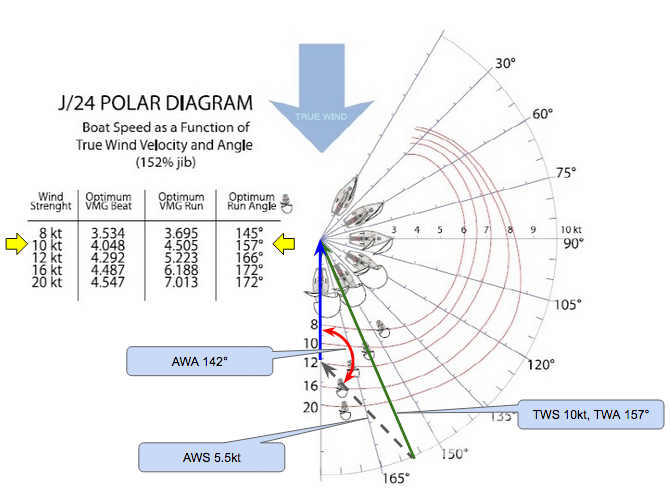
Let’s take our J/24 polar diagram and overlay our true to apparent vector triangle. We read the boatspeed directly off the speed plot and see it’s 5.1 knots. So we draw the blue boatspeed line at 5.1kts and then connect the base to the arc representing 10 kts of true wind speed. Then we plot the apparent wind line to the other end of the boatspeed vector and we have our apparent wind speed and direction.
So now we know TWA, TWS, Boatspeed, AWA and AWS for the optimal downwind angle for 10 knots of wind. Why would we care about knowing the AWA? Because on a boat that has no instruments, but has a masthead fly (like, say a Merit 25) we now have a way to judge whether we’re sailing the best angle downwind.
In 10 knots of wind, we should strive for a boat speed of just over 5 knots at an apparent wind angle of 142°.
Building out a complete AWA, AWS table
We can repeat this plot (or calculation) for each windspeed that’s listed in the polar table and the outcome is shown below. Note that this is a standard table built from the rating certificate for the J/24. Also below is an illustration of TWA and Gybing angle.
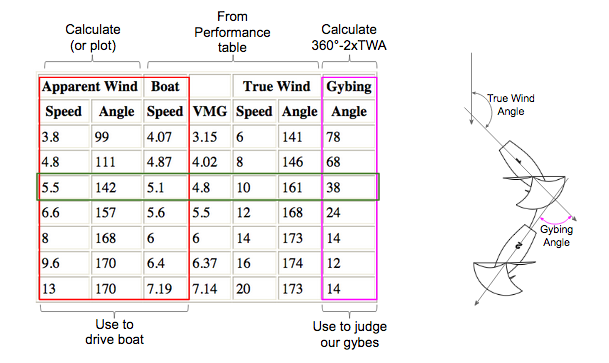
How would we use this?
When racing a Merit 25 with a spinnaker, there is much to be gained (or lost) on the downwind legs and judging gybing angles is less familiar to most skippers than judging tacking angles.
If you like keeping things simple, here’s what you’ll want to know:
In light winds of 6-8 knots, sail downwind with the windex showing apparent wind 10°-15° behind the beam and no faster than 5 knots. If you’re going faster, head lower.
In moderate winds from 10-12 knots, sail downwind with the windex showing apparent wind about half way between abeam and dead astern and no faster than 5.5 knots. If you’re going faster, head lower.
If sailing under jib and main, sail almost directly downwind, heading up only enough to keep the jib from collapsing, AWA 165°-175°
Doing the math
For those who prefer calcs to measuring lines on charts, here are the formulae to resolve AWS (A) and AWA (?).